Friday, July 31, 2015

The 2015 Untrustworthies Report - Why Social Security Could Be Bankrupt In 12 Years

Tyler Durden's picture

The so-called “trustees” of the social security system issued their annual report last week and the stenographers of the financial press dutifully reported that the day of reckoning when the trust funds run dry has been put off another year—-until 2034.
So take a breath and kick the can. That’s five Presidential elections away!
Except that is not what the report really says. On a cash basis, the OASDI (retirement and disability) funds spent $859 billion during 2014 but took in only $786 billion in taxes, thereby generating $73 billion in red ink.  And by the trustees’ own reckoning, the OASDI funds will spew a cumulative cash deficit of $1.6 trillion during the 12-years covering 2015-2026.
So measured by the only thing that matters—-hard cash income and outgo—-the social security system has already gone bust. What’s more, even under the White House’s rosy scenario budget forecasts, general fund outlays will exceed general revenues ex-payroll taxes by $8 trillion over the next twelve years.
Needless to say, this means there will be no general fund surplus to pay the OASDI shortfall. Uncle Sam will finance the entire $1.6 trillion cash deficit by adding to the public debt. That is, Washington plans to make social security ends meet by burying unborn taxpayers even deeper in national debt in order to fund unaffordable entitlements for the current generation of retirees.
The question thus recurs. How did the untrustworthies led by Treasury Secretary Jacob Lew, who signed the 2015 report, manage to turn today’s river of red ink into another 20 years of respite for our cowardly beltway politicians?
They did it, in a word, by redeeming phony assets; booking phony interest income on those non-existent assets; and projecting implausible GDP growth and phantom payroll tax revenues.
And that’s only the half of it!
The fact is, the whole rigmarole of trust fund accounting enables these phony assumptions to compound one another, thereby obfuscating the fast approaching bankruptcy of the system. And, as will be demonstrated below, that’s what’s really happening—–even if you give credit to the $2.79 trillion of so-called “assets” which were in the OASDI funds at the end of 2014.
Stated differently, the OASDI trust funds could be empty as soon as 2026, thereby triggering a devastating 33% across the board cut in benefits to affluent duffers living on Florida golf courses and destitute widows alike. Needless to say, the army of beneficiaries projected for the middle of the next decade—what will amount to the 8th largest nation on the planet—- would not take that lying down.
There would be blood in the streets in Washington and eventually staggering tax increases to fund the shortfall. Such desperate measures, of course, would sink once and for all whatever faint impulse of economic growth and job creation that remained alive in the US economy at the time.
In short, this year’s untrustworthies report amounts to an accounting and forecasting house of cards that is camouflaging an impending social, political and economic crisis of a magnitude not seen since the Great Depression or even the Civil War.  So here follows an unpacking of the phony accounting edifice that obscures the imminent danger.
The place to start is with the one data series in the report that is rock solid. Namely, the projected cost of $15.5 trillion over the next 12 years to pay for retirement and disability benefits and the related (minor) administrative costs.
This staggering figure is derived from the fact that the number of beneficiaries will grow from 59 million to 79 million over the next twelve years, and that each and every one of these citizens has a payroll record that entitles them to an exact monthly benefit as a matter of law. Even the assumed COLA adjustment between 2-3% each year is pretty hard to argue with—-since it is nearly dead-on the actual CPI increase average since the year 2000.
By contrast, the funny money aspect comes in on the funding side. The latter starts with the $2.79 trillion of “assets” sitting in the OASDI trust funds at the end of 2014.
In truth, there is nothing there except government accounting confetti. This figure allegedly represents the accumulated excess of trust fund income over outgo historically, but every dime of that was spent long ago on aircraft carriers, cotton subsidies, green energy boondoggles, prison facilities for pot smokers, education grants, NSA’s cellphone monitors, space launches and the rest of Washington’s general government spending machine.
So when the untrustworthies claim that that social security is “solvent” until 2034 the only thing they are really saying is that this $2.79 trillion accounting artifact has not yet been liquidated according to the rules of trust fund arithmetic. And under those “rules” its pretty hard to actually accomplish that—-not the least due to the compounding of phantom interest on these phantom assets.
To wit, the 2015 report says that the OASDI funds will earn $1.2 trillion of interest income during the next twelve years. To be sure, the nation’s retirees and savers might well ask how Washington’s bookkeepers could manage to get the assumed 3.5% interest rate on the government’s assets compared to the 0.3% ordinary citizens earn on a bank account or even 2.2% on a 10-year treasury bond.
But that’s not the real scam. The skunk in the woodpile is actually an utterly arbitrary and unjustifiable assumption about the rate of nominal GDP growth and therefore the associated gain in projected payroll tax revenues coming into the trust fund.
What the untrustworthies have done here is indulge in the perfidious game of goal-seeked forecasting. That is, they have backed into a GDP growth rate sufficient to keep payroll tax revenues close to the level of benefit payouts, thereby minimizing the annual cash deficit.
This, in turn, ensures that the trust fund asset balance stays close to its current $2.7 trillion level in the years just ahead, and, mirabile dictu, permits it to earn upwards of $100 billion of “interest” each year. Too be sure, beneficiaries could not actually pay for their groceries and rent with this sort of trust fund “income”, but it does keep the asset balance high and the solvency can bouncing down the road a few more years.
But here’s the thing. Plug in a realistic figure for GDP growth and payroll tax revenue increases and the whole trust fund accounting scheme collapses; the bouncing can runs smack dab into a wall of trust fund insolvency.
To wit, the untrustworthies who wrote the report assumed that nominal GDP would grow at a 5.1% annual rate for the next 12 years. Yet the actual growth rate has never come close to that during the entire 21st century to date. At best these people are dreaming, but the truth is they are either lying or stupid.
Given the self-evident headwinds everywhere in the world, and year after year of failed “escape velocity” at home, no one paying a modicum of attention would expect US GDP to suddenly get up on its hind legs and race forward as far as the eye can see. Yet that’s exactly what the social security untrustworthies have done by assuming nominal GDP growth 35% higher than the actual 3.8% compound growth rate since the year 2000.
But its actually worse. Since reaching peak debt just prior to the financial crisis, the US rate of GDP growth has decelerated even more. And going forward, there is no meaningful prospect of recovery in the face of the growing deflationary tide in the global economy and the unavoidable necessity for the Fed and other central banks to normalize interest rates in the decade ahead. Failing that they will literally blow-up the world’s monetary system in a devastating currency race to the bottom.
Thus, during Q1 2008, which marked the end of the domestic credit binge, nominal GDP posted at $14.67 trillion, and during the most recent quarter it came in at $17.69 trillion.That amounts to an seven-year gain of just $3 trillion and an annual growth rate of 2.7%.
Now surely there will be another recession before 2026. If not, we will end up with 200 straight quarters of business cycle expansion—-a preposterous prospect never remotely experienced previously. Indeed, in our modern central bank driven world, where both recessions this century have resulted from the bursting of financial bubbles, the proposition is even starker. Namely, no bursting bubbles or market crashes for 18 years!
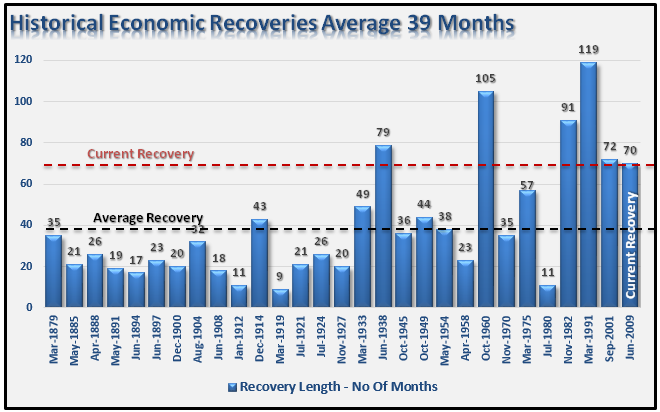
No, the historical business cycle expansions depicted below make clear that there will be another business cycle downturn. After all, contrary to the untrustworthies assumption that the current business cycle will last forever, and, in the analysis at hand for 200 months through the end of 2026, the average expansion has lasted just 39 months and the longest ever was only 119 months.
During the last business cycle contraction, in fact, nominal GDP declined by 3.4% between Q3 2008 and Q2 2009. And when you average that in with the 3.3% nominal GDP growth rate which we have had during the so-called recovery of the last four years, you not only get the aforementioned 2.7% trend rate of nominal GDP growth, but you are also hard-pressed to say how it can be bested in the years ahead.
Economic-Recoveries-Historical-050515
Indeed, there is a now an unprecedented deflationary tide rolling through the world economy owing to the last 15 years of rampant money printing and financial repression by the central banks. By collectively monetizing upwards of $20 trillion of public debt and other existing securities and driving interest rates toward the zero bound in nominal terms and deep into negative territory in real terms, they have generated two massive, deflationary distortions that have now sunk deep roots in the world economy.
First, credit market debt outstanding has soared from $85 trillion to $200 trillion. This means future economic growth practically everywhere on the planet will be freighted-down by unprecedented, debilitating debt service costs.
At the same time, massive overinvestment in mining, energy, shipping and manufacturing spurred by central bank enabled cheap capital has generated a huge overhang of excess capacity. This is already fueling a downward spiral of commodity and industrial prices and profit margins, and there is no end in sight.
Iron ore prices which peaked at $200 per ton a few years back, for example, are now under $50 and heading for $30. Likewise, met coal prices which peaked at $400 per ton are heading under $100, while crude oil is heading for a retest of the $35 level hit during the financial crisis, and copper is on track to plunge from its recent peak of $4/pound toward $1.
These deflationary currents will suppress nominal income growth for a decade or longer owing to a now commencing counter-trend of low capital investment, shrinking industrial profits, tepid wage growth and falling prices for tradable goods and services.Accordingly, even maintaining the average nominal GDP growth rate of 2.7% realized over the last seven years will be a tall order for the US economy.
Needless to say, the law of compound arithmetic can be a brutal thing if you start with a delusional hockey stick and seek to bend it back to earth. In this case, the trustee report’s 5.1% GDP growth rate assumption results in $31 trillion of GDP by 2026. Stated differently, compared to only $3 trillion of nominal GDP growth in the last 7 years we are purportedly going to get $14 trillion in the next 12 years.
But let’s see. If we stay on the current 2.7% growth track, then GDP will come in at $24 trillion in 2026. Since OASDI payroll taxes amount to about 4.5% of GDP, it doesn’t take a lot of figuring to see that trust fund income would be dramatically lower in a $7 trillion smaller economy.
To be exact, the untrustworthies have goal-seeked their report to generate $1.425 trillion of payroll tax revenue 12-years from now. Yet based on a simple continuation of the deeply embedded GDP growth trend of the last seven years, payroll revenue would come in at only $1.1 trillion in 2026 or $325 billion lower in that year alone.
And here’s where the self-feeding illusion of trust fund accounting rears its ugly head.What counts is not simply the end-year delta, but the entire area of difference under the curve. That’s because every cumulative dollar of payroll tax shortfall not only reduces the reserve asset balance, but also the phantom interest income earned on it.
So what happens under a scenario of lower payroll tax revenues is that the $2.7 trillion of current trust fund “assets” begins circling the  accounting drain with increasing velocity as time passes. In effect, the permission granted to Washington to kick the can by this year’s untrustworthies report gets revoked, and right fast.
To wit, instead of a cumulative total of $13.2 trillion of payroll tax revenue over the next 12 years, the actual, demonstrated GDP growth path of the present era would generate only $11.2 trillion during that period. That $2 trillion revenue difference not only ionizes most of the so-called trust fund assets, but also reduces the ending balance so rapidly that by the final year interest income computes to only $25 billion, not $100 billion as under the current report.
In short, by 2026 trust fund revenue would be $400 billion per year lower owing to lower taxes and less phantom interest. Accordingly, the current modest projected trust fund deficit of $150 billion would explode to upwards of $600 billion after the last of the phony interest income was booked.
Needless to say, that massive shortfall would amount to nearly 33% of the projected OASDI outgo of $1.8 trillion for 2026. More importantly, instead of a healthy cushion of $2.4 trillion of assets (or two year’s outgo) as the untrustworthies projected last week, the fund balance would be down to just $80 billion at year-end 2026.
Now that’s about 15 days of the next year’s OASDI outlays. The system would go tilt. Benefits would be automatically cut back to the level of tax revenue or by 33%. The greatest social crisis of the century would be storming out of every hill and dale in the land.
Yes, Jacob Lew is a Washington-Wall Street apparatchik who wouldn’t grasp the self-destructing flaws of trust fund accounting if they smacked him in the forehead. And the same is apparently true for the other trustees.
But here’s where the venality comes in. In order to goal-seek to 5% nominal GDP growth, the trustees report assumes that real GDP will average 3.1% per year through the year 2020.
Now, c’mon folks. Since the pre-crisis peak in late 2007, real GDP growth has averaged only 1.2% annually, and only 1.8% per year during the entire 15-years of this century.
Anybody who signed up for 3.1% real growth through 2020——that is, for scorching growth during month 67 through month 140 of a tepid business cycle expansion which is already long-in-the-tooth by historical standards—-is flat-out irresponsible and dishonest.
Calling their mendacious handiwork the “untrustworthies report” is actually more flattering than they deserve.

Cold Supply Chain Technology Leader Promotes New Environmental Publication with Profits to Charity  

Stunning Facts Behind the Obscenity of Wasted Food Revealed in Climate Change Book

Shipping News FeatureUS – WORLDWIDE – As a leader in the field of cold chain transport technology the Carrier organisation knows better than most the importance of preserving fresh food as it travels through the supply chain. Now the company is using that unique perspective on the global food system to highlight the stunning amount of food wasted globally and pointing out that, if food waste were a country, it would be the third largest emitter of greenhouse gases behind China and the United States. Carrier is publicising a cheap, easily accessible paperback which highlights the environmental obscenity which is discarded produce.
In the new 182-page book, called Food Foolish: The Hidden Connection Between Food Waste, Hunger and Climate Change, co-authored by John Mandyck, chief sustainability officer, UTC Building & Industrial Systems, and Carrier’s parent company, and Eric Schultz, former chairman and CEO ofSensitech, another UTC company specialising in cold chain monitoring and visibility, the case is made for the extraordinary social and environmental opportunities which could be created by wasting less food. As Eric Schultz points out:
“The very foods we need to address global nutrition and meet consumer demand are the most water-intensive and require the greatest protection along the supply chain. Their loss and waste not only intensifies hunger, but destroys our freshwater resources.”
One-third or more of the food we produce each year is never eaten. Meanwhile, more than 800 million people, a population equivalent to the United States and European Union combined, are chronically hungry. Food waste also has a devastating environmental impact. The embodied carbon dioxide emissions in food waste alone represent 3.3 billion tonnes. That’s the energy used to produce food that’s never eaten, including fuel for tractors used for planting and harvest, electricity for water pumps in the field and the power for processing and packaging facilities. In addition to greenhouse gas emissions, the water used to grow the food we throw away is greater than the water used by any single nation on the planet.
The impacts of food waste are magnified by our growing planet. The world’s population is expected to grow by another 2 billion people by 2050, with the added challenge of feeding more. Food Foolish was co-written by Mandyck and Schultz and features forewords from Philippe Cousteau, founder of EarthEcho International and Emmy-nominated television host, and Barton Seaver, explorer with National Geographic and director of the Healthy and Sustainable Food Program at the Center for Health and the Global Environment at the Harvard T.H. Chan School of Public Health. John Mandyck says:
“Hunger, food security, climate emissions and water shortages are anything but foolish topics. The way we systematically waste food in the face of these challenges, however, is one of humankind’s unintended but most foolish practices. We hope this book will be a catalyst for a much needed connected global dialogue on an issue that we believe is essential to the sustainability of the planet.
“We already produce enough food to feed 10 billion people, everyone today and those expected by 2050. We must implement readily available strategies to avoid food loss and extend food supplies, including energy efficient, sustainable and affordable technologies that better preserve food during transport and distribution, improved food safety standards and a change in consumer behaviour. When we waste less, we feed more. Without action, the low-hanging fruit for reducing climate change will continue to literally rot before our eyes.”

Why Do So Many Working Age Americans Choose Not To Enter The Workforce?

Via ConvergEx's Nick Colas,
Today we look at a unique dataset – Gallup’s annual poll of job satisfaction – to see what it can tell us about secular trends in employment, consumer confidence and spending.  This annual survey of +1,000 people active in the U.S. workforce goes back to the late 1980s, so it is a useful lens with which to consider issues like labor force participation rates that have shifted unexpectedly over the period.

Most surprising news first: Americans express a broad satisfaction with their jobs, regardless of economic conditions. The very worst reading since 1989 was in 2011 when “Only” 83% of respondents said they were either “Somewhat” or “completely” satisfied with their jobs.  The peak was in 2007 at 94%, and last year (August 2014) it was 89%.

The key takeaway is that declining labor force participation rates since the year 2000 (67% then, 62.6% now) aren’t because of any systemic disaffection with the American workplace. 

The other notable takeaway: workers are (strangely, we must say) satisfied with what they earn. Those expressing “Complete” satisfaction with their paystub hit a high last year (31%) not seen since 2010 and 2006…  Wage inflation?  What for?
You could call it the “Mystery of the Missing Worker” – why do so many people of working age chose not to enter the workforce?  Here are the numbers, as of the most recent Employment Situation report:
  • 250 million: the total number of people of working age in the United States. 
  • 149 million: the total number of people in that population that have a job.
  • 8 million: the number of people who want a job but do not have one.
  • 93 million: the number of people who don’t work, and don’t want work.
To put some context around that last number, it is 30% of the entire U.S. population.  This is the same as the current population of the entire West Coast (CA, OR, and WA) AND New York State AND Florida.  Plus another 10 million people.  Economists measure this with the Labor Force Participation rate, and it has been in decline since February 2000, when it peaked at 67.3%.  It is now 62.6% and last month was a new low back to the 1970s. People of working age increasingly do not consider themselves part of the labor force.  Most economists chalk this up to the demographics of an aging workforce even though virtually all the literature on the topic in the early 2000 predicted participation would continue to increase. 
We recently took a long look at a dataset that doesn’t often see the light of day but does provide some useful takes on how workers view their jobs.  It comes from the Gallup organization and is an annual survey of +1,000 employees since 1989 on their perceptions of job satisfaction in all its forms, from health and safety concerns to compensation to job security.  The complete data set can be found here, and the charts below highight the trends...
But here are the important takeaways.
#1: Americans are consistently satisfied with their jobs, although the readings vary slightly through a given economic cycle. The highest ever combined responses of “Completely Satisfied” and “Satisfied” was in 2007 at 94%. The worst since the start of the survey in the late 1980s was 2011, at 82%.  Last year – the results come out every August – the combined reading was 58% “Completely” and 31% “Somewhat” Satisfied, for a total of 89%.

#2: They also feel relatively secure in their positions.  Last year some 88% reported being “Completely” (58%) or “Somewhat” (31%) satisfied by the security offered by their jobs and, implicitly, their employers.  The worst readings were in 2009 at 80% total and in the early 1990s at 79%.

#3: Workers also report high levels of satisfaction with what they receive in terms of compensation.  Back in 1991 – the worst year in terms of general reported satisfaction for this question – “only” 66% of respondents were completely or somewhat satisfied with their pay stubs.  Even during the Financial Crisis and its aftermath that number troughed at 70% in 2011. Last year a total of 75% of respondents were satisfied with what they received for compensation.

#4: Workers who respond to the Gallup survey last year have the biggest gripes about health insurance benefits (only 61% satisfied), retirement planning (only 63% satisfied) and chances for promotion (68%).

#5: Conversely, workers reported exceptionally high levels of satisfaction in their relations with co-workers (95% completely or somewhat satisfied), physical safety (93%) and the flexibility of their hours (90%).
Frankly, when we started to look at these numbers we expected to see a mirror of the volatility common in consumer confidence surveys.  A few points here:
  • Consumer confidence as measured by the Conference Board peaked in 1966/67 and again in the late 1990s at readings of +140. 
  • Troughs occurred in the early 1970s, late 1970s/early 1980s and post September 11 at readings of 50 or so. 
  • The Financial Crisis took us down to below 30 in 2008 and readings struggled to get past 70 until 2013. 
We therefore thought that Americans would feel broadly the same about their work situations as they did the economy as a whole - that things are still pretty bad and the past was much better than the present.  This turned out not to be the case.  Yes, they express some marginal disaffection when times are hard, but the trough reading during and after the Financial Crisis was 83% satisfied with their jobs.  Hardly a pitchforks and barricades kind of number.  
In short, we can’t blame lower participation rates on the nature of work – broadly speaking – offered in the American economy.  In Internet parlance, the American workplace gets 4 ½ stars and a lot of recommendations.  Perhaps, in the words of Yogi Berra: “No one goes to that restaurant any more.  It’s too crowded”.
*  *  *
Of course, when work is punished in the Entitlement State Americans live in...what else should we expect but 30% of the employable to sit at home? As we previously explained,
This isthe painful reality in America: for increasingly more it is now more lucrative - in the form of actual disposable income - to sit, do nothing, and collect various welfare entitlements, than to work.

This is graphically, and very painfully confirmed, in the below chart from Gary Alexander, Secretary of Public Welfare, Commonwealth of Pennsylvania (a state best known for its broke capital Harrisburg). As quantitied, and explained by Alexander, "the single mom is better off earnings gross income of $29,000 with $57,327 in net income & benefits than to earn gross income of $69,000 with net income and benefits of $57,045."


We realize that this is a painful topic in a country in which the issue of welfare benefits, and cutting (or not) the spending side of the fiscal cliff, have become the two most sensitive social topics. Alas, none of that changes the matrix of incentives for most Americans who find themselves in a comparable situation: either being on the left side of minimum US wage, and relying on benefits, or move to the right side at far greater personal investment of work, and energy, and... have the same disposable income at the end of the da

It’s Amazon’s World. The USPS Just Delivers in It

The U.S. Postal Service has become an extension of Amazon and is courting other e-commerce giants
How Amazon Convinced USPS to Work on Sun
on FacebookShare on Twitter


In cities such as San Francisco and New York, letter carriers have been showing up on people’s doorsteps as early as 3 a.m. bearing unusual cargo: milk, eggs, and other perishable items. The U.S. Postal Service has been delivering groceries to customers of Amazon.com in selected areas since October 2014. “It’s just leveraging our infrastructure,” says Megan Brennan, who was sworn in as America’s 74th postmaster general in March, becoming the first woman to hold the job in the institution’s 240-year history. “We’re on people’s doorstep six days a week, seven days a week in some cases. It’s just a logical progression.”
A former letter carrier from Pottsville, Pa., Brennan is trying to transform the USPS into a delivery service for the e-commerce era. That means hauling fewer letters and more packages. It means showing up with them at once-unheard-of hours and even on Sundays. “Amazon is the first,” Brennan says. “But we’re obviously looking to get additional customers who are interested in that type of customized delivery.”
Brennan’s predecessor, Patrick Donahoe, announced in November 2013 that the Postal Service would do deliveries for Amazon seven days a week. Since then, the Seattle giant has assembled a network of more than 15 facilities where it sorts packages it then trucks to nearby post offices, so letter carriers can take them the rest of the way. Amazon said in a recent regulatory filing that it plans to build more of these sorting centers this year.


The USPS doesn’t disclose much about its relationship with Amazon, citing confidentiality agreements. Amazon didn’t respond to several requests for comment. David Vernon, an analyst at Bernstein Research who tracks the shipping industry, estimates the USPS handled 40 percent of Amazon’s volume last year—or almost 150 million items—more than either United Parcel Service or FedEx. He figures that Amazon pays the USPS $2 per package, which is about half what it would pay UPS and FedEx. Vernon says Amazon receives a deep discount from the USPS because the e-tailer does so much of its own processing—including providing computerized address lists to make it easier for carriers to tailor their delivery routes for faster drop-offs. “I think [Amazon’s] idea was, why give this volume to FedEx when we can just sort it ourselves?” Vernon says. “Because it’s not that hard.”
Brennan needs all the new business she can get. In 2014 first-class mail volume fell 3 percent compared with the previous year, to 64 billion pieces. Advertising mail, which some people refer to as junk mail, remained essentially unchanged. But the USPS’s package volume climbed 8 percent from the year before, to 4 billion items, and accounted for 20 percent of the agency’s $68 billion operating revenue.
Yet as its package volume rises, the USPS has had to invest in new equipment. Last year it spent $200 million to furnish its carriers with 270,000 Internet-connected handheld scanners made by Honeywell that enable them to provide real-time package tracking. “The Postal Service is far more technology-centric than most people would understand or believe,” Brennan says. The agency is also hoping to replace its fleet of 189,750 delivery trucks, most of which are 25 years old and not configured to hold packages. The USPS Office of the Inspector General estimates this will cost more than $5 billion.
These expensive upgrades come at a time when the USPS is essentially broke. It expects to lose $6.1 billion this year and as of late March had only $6 billion in cash, enough to keep running for 22 days. Brennan has been quietly calling on various political leaders and special-interest lobbyists in Washington whose support she needs to fix her troubled agency. A top priority: getting Congress to pass legislation that would require USPS retirees to use Medicare as their primary health insurance. This would eliminate the need to pay $5 billion a year to fund future retiree health benefits, as the agency is now required to do by law. It hasn’t been able to make the payments since 2011.


The USPS’s package growth gives Brennan something more pleasant to discuss with lawmakers and lobbyists than the inexorable decline of first-class mail. Even conservative Republicans, who object to proposals championed by U.S. Senator Elizabeth Warren (D-Mass.) and others for the USPS to get into new businesses such as banking, want to see the agency deliver more e-commerce-generated boxes. “Nobody ever said they shouldn’t be delivering packages,” says Jason Chaffetz (R-Utah), chairman of the House Committee on Oversight and Government Reform, which oversees the USPS.
Postal union leaders, who don’t always see eye to eye with management, are similarly enthusiastic. “We’ve been trying to get the Postal Service to do this kind of thing for years,” says Brian Renfroe, director of city delivery for the National Association of Letter Carriers.
The USPS says it’s making Sunday deliveries for other companies, which it refuses to name. But it may be a while before Brennan lands another client as big as Amazon, which, besides the sorting centers, has 50 enormous distribution warehouses across the U.S. “The only company in America right now that has so many distribution centers purely for e-commerce is Amazon,” says Marc Wulfraat, founder of MWPVL International, a logistics consulting firm in Montreal. “Wal-Mart’s probably the next-biggest player with, say, six or seven, and it drops off real fast after that.”
In the meantime, the USPS is tethered to Amazon, a company that isn’t just a customer—it’s also a competitor. In cities such as New York and Washington, where the USPS is testing same-day delivery, Amazon offers a similar service. The e-tailer has its own AmazonFresh grocery delivery trucks. And it’s seeking permission from the Federal Aviation Administration to make deliveries using aerial drones. Given its gargantuan ambitions, Amazon could even recruit its own army of delivery people. But Brennan isn’t concerned about that. The last thing Amazon Chief Executive Officer Jeff Bezos probably wants to do now after building all those sorting centers is hire more than 300,000 men and women to carry packages like the USPS. Even in the age of Amazon, that’s the Postal Service’s undeniable edge.
The bottom line: The U.S. Postal Service handled an estimated 40 percent of Amazon’s deliveries in 2014.

Wednesday, July 29, 2015

E-Commerce Supply Chain Advice From Top Retailers


By Irv Grossman, EVP of the Americas, Chainalytics


When you need to know the best way to do something, you learn from the people who are already excelling at it.
That’s what audience members did during the panel discussion on the future of e-commerce supply chains that we were called on to assemble at the 2015 Georgia Logistics Summit.E-Commerce-Insights-2015
Thought leaders on the panel included:
  • Moderator, Mike Kilgore, CEO, Chainalytics
  • Bill Connell,  Senior Vice President of Logistics and Operations, Macy’s
  • Colby Chiles, Senior Director of Customer Delivery, Home Depot
  • Brad Taylor, Senior Director of Distribution, Chico’s FAS
  • Steven Hong, President, Sylvane

Speaking to a full house of over 200 attendees, it was clear that the panelists shared perspectives on omni-channel retail supply chains that were dead-on and applicable far beyond the Georgia’s borders. I felt compelled to share.
Six main points emerged as top trends that each of these visionary thinkers see happening in the e-commerce supply chain and fulfillment space.

Six Trends of E-Commerce Supply Chains

1. Omni-Channel is driving investment in brick and mortar.

The old notion that you have to go digital to become truly omni-channel is yesterday’s news; companies that are not online are so far behind that they aren’t considered competition anymore. Instead, the omni-channel universe is leading to expansion in the physical world, as more stores are built that can serve as fulfillment centers for outbound shipments, as well as customer pick-ups, inventory management and returns.
Buy online, pick-up in store has proven to be a breakout success and the interplay between physical and virtual shopping channels strengthens both. The trend of online pure plays expanding to brick and mortar can be expected to continue.

2. Differentiation is key to success.

Competing with established online giants at their own game is a losing battle. Instead, success comes from focusing on what you do well and perfecting it. For example, Macy’s is finding success by leveraging its vast network of stores and quality private label brands while Home Depot is one of the few shippers that truly understands how to facilitate heavy and difficult-to-ship merchandise fulfillment.
This competition among retailers results in the acceleration of customer expectations, serving them more efficiently, all while differentiating the experience along the way to deliver what they really want.

3. No longer a support service, supply chains now have a       front seat in corporate strategy.

Brad Taylor struck a chord when he mentioned that even though Chico’s is rarely a first mover in new services, it still views investments in supply chain as key to remaining nimble enough to evolve with customers’ complex and changing shopping demands.
Colby Chiles reiterated the importance of agility by pointing out that logistics must be in place before new services can be launched, but they must also be easily scalable to adjust for unplanned-for demand signals. The process should proceed like this: launch, evaluate demand signal, then optimize. The supply chain has to be in place on day one, but also flexible enough to be optimized for what the demand signals indicate.

4. The RFID experiment is over. It succeeded.

Bill Connell explained Macy’s began implementing RFID technology three years ago to maintain accuracy in its inventory. The 95-98 percent confidence level the company has achieved on its inventory levels allows it to fulfill from over 800 stores. At the same place in its lifecycle that bar codes were in the 80s, RFID is expected to become ubiquitous within five years and most retailers will wonder how they ever lived without it; especially when the inventory counts that used to take all day only take 15 minutes.

5. Don’t write off drop shipping.

Steven Hong said that 40 percent of his company’s supply chain headaches are caused by the 20 percent of his orders that are drop shipped; but that doesn’t mean he’s going to cut it from his distribution mix any time soon. It simply allows him to carry way more SKUs than he would ever be able to hold in inventory.
Even large retailers with virtually limitless inventory capacity often include drop shipping on items where volume does not warrant internal fulfillment, but demand is strong enough to keep the item available to customers.
Smart fulfillment management requires analyzing which SKUs make the most sense to keep in inventory vs. which are wiser to drop ship, and constantly re-evaluating orders to optimize the ratio.

6. Nobody wants to pay for expedited shipping. 

In a bit of paradox, customers want fast shipping — but they don’t want to pay for it.
In the battle between those scenarios, free shipping beats fast shipping. None of the companies on this panel reported more than 1 percent of their orders being sent with shipping that carries extra costs.
Home Depot has offered same-day onsite deliveries for professional contractors for years, but very few contractors are willing to pay for 2- or 4-hour delivery windows, instead opting for flexible all-day windows or for doing the pick-up themselves.
Locating supply closer to customers makes even more sense in a world where consumers want it tomorrow…but only if shipping is free.
The single most-important takeaway from this informative 90-minute discussion is this: 
Only retailers that are in constant touch with evolving consumer expectations stand a chance of successfully fulfilling orders and keeping customers engaged, and the agility to serve whatever comes next quickly and efficiently is of paramount importance.
Bottom line: Wal-Mart’s Yihaodian could sharply boost its share of China’s e-commerce market in the next 2-3 years, following a buyout that will give the site better access to its parent’s experience, offline stores and global connections.
Just a week after sacking the 2 founders and top executives of its China e-commerce site, global retailing giant Wal-Mart (NYSE:WMT) has taken the next step and bought out its partners in their Yihaodian joint venture. The buyout completes a takeover that began with Wal-Mart’s purchase of a controlling 51 percent of Yihaodian 3 years ago. It also signals that Wal-Mart is preparing to pump major new investment into the site, as it tries to become a major player in a market dominated by local giants Alibaba (NYSE:BABA) and JD.com (NASDAQ:JD).
I have to applaud Wal-Mart for finally taking control and tossing out Yihaodian’s founders, who weren’t doing much to challenge any of the nation’s top e-commerce sites. But that said, foreign companies have a very poor track record competing with homegrown Chinese Internet firms, and it's far from clear if Wal-Mart can succeed where other big names like Google (NASDAQ:GOOG) (NASDAQ:GOOGL), Yahoo (Nasdaq: YHOO), Expedia (Nasdaq: EXPE) and eBay (Nasdaq: EBAY) have failed in the past.
Yihaodian looked like a rising e-commerce star when Wal-Mart took control of the company by buying its 51 percent stake in 2012. It tried to carve out niches in the online grocery space and the market for imported goods, drawing on some of its own connections and areas of expertise. But despite those efforts, Yihaodian remains a bit player in the broader China e-commerce market with less than 1 percent share.
Wal-Mart was clearly running out of patience with Yihaodian founders Yu Gang and Liu Junjun, who were also the chairman and CEO when they suddenly resigned less than 2 weeks ago. (previous post) Now Wal-Mart is saying it has officially taken full control of Yihaodian by buying out the remaining 49 percent of the company from Yu, Liu and another major stakeholder. (company announcementChinese article)
Wal-Mart also announced that Wang Lu would take over as head of Yihaodian as part of his broader responsibilities as its Asia head of e-commerce. No terms were given for the buyout, but I would expect Wal-Mart paid around $200-$250 million, which is roughly half the market value of Dangdang (NYSE:DANG), a company of similar size that is also struggling.

Accelerating Investment, Offline Integration Ahead

Wal-Mart didn’t comment in detail on its future plans, but said it will invest in accelerating e-commerce in China and also in integrating Yihaodian with its traditional offline stores. That kind of integration is often referred to as online-to-offline (O2O), and has been a focus recently for Chinese Internet companies that are forging growing alliances with traditional retailers like department and convenience stores.
I would expect Wal-Mart to invest aggressively in Yihaodian following this move, potentially pumping hundreds of millions of dollars into the company as it plays catch-up to more aggressive names like Alibaba and JD.com. US online retailing giant Amazon (NASDAQ:AMZN) has tried a similar strategy in China, but so far has met with limited success and is still a relatively small player.
Part of the problem for names like Wal-Mart and Amazon is their stronger focus on issues like quality control than Chinese rivals. That focus means they rely more on a direct sales model, compared with an open-platform model used by many Chinese rivals who bring together consumers and third-party merchants over open online marketplaces. Such third-party merchants are notoriously difficult to control, which was a big factor behind a scandal at Alibaba early this year when a Beijing regulator accused the firm of tolerating rampant piracy on one of its main e-commerce sites.
All that said, I do have to commend Wal-Mart for finally taking control of Yihaodian after failing to gain much traction under its previous top executives. Other companies like eBay and Yahoo made similar moves by quickly sidelining company founders after making major China acquisitions in the past. Both of those moves ended up relatively disastrous. But in this case, Wal-Mart will have the benefit of a bit more familiarity with Yihaodian, since it waited 3 years before dumping the company’s founders.
Wal-Mart will also benefit from potential synergies with its well-run network of traditional brick-and-mortar stores in China. It could gain as well from growing pressure on companies like Alibaba and JD.com to adopt more global standards for their operations. For all those reasons, I would give this new Yihaodian better chances of success than previous foreign Internet ventures in China, and could see the company quickly double its market share to 2 or even 3 percent of the market in the next 2 years.